greenhills使用教程

粉丝2329获赞1.0万
相关视频
 06:10查看AI文稿AI文稿
hello, this is karen in the screencast, i'll be talking about how to enable a checked build, but first i'll explain what it is and when you would want to use it a check build enables a pound to find that instruments the code to display extra diagnostic messages to the console while running an integrity target a check build also replaces the standard colonel binary with one that was pre built using the special pound define allowing you to use an instrumented version of the colonel even if you don't have colonel source code while this is not an exhaustive list a check build is useful for the following types of scenarios when you're seeing an interrupt panic condition when your system indicates an exception or fatal error or when you're having trouble bringing up an io device for example let's say that you see an interrupt message in the console when your target boots, but the panic message doesn't really offer many clues the best way to get more information is to use a checked bill to enable the display of extra diagnostic messages or maybe you're having trouble getting pci to work if checkbuild is enabled the pci initialization will print out information about the devices found and the requirements this can help provide clues to diagnose configuration problems the easiest way to enable check build is to go to the upper right corner of the multi project manager if you're using multi seven or later set the checked option in the build configuration drop down menu and then rebuild your project if you aren't using multi seven and you don't have a drop down in the multi project manager window you can get this same functionality with two steps first navigate to your bsps dot gbj file if you aren't sure where to find your bsp project a great place to start would be the file menu, open reference, bsp and then step through the wizard choosing the options that fit your target you should end up with a project manager that looks similar to mine to enable the check build on the bsp highlight the bsp project and then right click to select edit which allows you to add this line to the list of indented options dash d uppercase checked underscore uppercase build note that the indentation is important here save the change and rebuild your bsp now if you'd rather enable check village using the gooey you would right click on the bsp project choose set build options then right click on define pre processor symbol and choose set define pre processor symbol you would add uppercase checked underscore build in this text field and then save and rebuild your bsp。 the second step is to find the colonel entry within your own application in this colonel project you'll want to link against the checked version of the colonel which was pre built by green hills with the checked build functionality to make this change highlight and right click to edit the colonel project then modified this line to use colonel underscore checked be sure that the line is indented then save and close or to use the gooey with the project highlighted right click and choose set build options then scroll down to operating system colonel project and right click to choose link with colonel with checked debug output enabled then save your change and rebuild your own project i should mention that the order of these steps is important you first need to add checked build to the bsp project file and rebuild the bsp and then link your own project with colonel checked and rebuild your code note you do not want to set the option on the sample kernel provided as part of your bsp project this setting should be placed in the kernel project val of your own application now with these changes your program will display more diagnostic messages to the console and as you might expect enabling a check build will also increase the size of your image slightly but this additional diagnostic information can provide clues to help debug many common startup problems for many reasons greenhill software recommends not using a checked building production or released version of your application so to disable check build in your multi project manager you would simply change the drop down by selecting release and then rebuild or if you don't have the build configuration menu drop down you would reverse the manual steps that we took earlier you would add at your bsp star gpj file to remove the dash d a checked underscore build line and then save or with the gooey you would right click choose set build options define, pre processor symbol and remove the checked build pound define that would be found here and then rebuild your bsp and then the second step would be to edit your colonel stat gpj file to link against the normal or use the set build options select operating system kernel project and choose the default kernel there then save your changes in rebuild your project to pull in the default libraries and remove the check build functionality well, that's it for enabling a check build thank you for watching。
2亿道电子 07:07查看AI文稿AI文稿
hello, this is karen welcome to my first in a series of screencasts on enabling trace for modern armed targets with the greenhills development environment in this video, i'll cover the following the pre requisites, you'll need to be able to enable trace successfully i'll provide a basic overview of trace using a zinc ultra scale as an example and the steps required to configure trace in the greenhouse environment, i'll demonstrate where to find information on the trace components using a target reference manual and we'll talk about the paths between the component that generates trace to the end point or trace data can be collected first, let's go over the prerequisites, you'll need that following to be able to successfully enable trace using this series of screencast a working trace capable arm target and its associated reference manual an installation multi seven in the compiler a greenhouse probe flashed with firmware, six or higher and a working run control probe configuration for your target in modern armed targets, each core that generates trace may route that trace to several different internal components these components vary and that some map upper trays like an e t, b or e t app others such as a corsite trace funnel may multiplex that trace into one trace stream and others might output trace through a tpiu or trace port interface unit arm refers to components that generate trace such as an etm or ptm as a trace source components that act as an endpoint for trace data on the soc, such as a tpiu are called trace sinks and the component that facilitates the transfer of trace data between a source and a sink is called a trace link there are three major steps for configuring trace, which involves translating arm target trace topology into information that the greenholes propes offer understands first, you identify the target's trace components in trace path then you'll need to correlate trace topology details into the greenhole's development environment and you'll need to configure your multi environment to successfully view trace data in the debugger this screencast will cover the first step how do i identify a target's trace components and available trace pads using the arm reference manual for your target hardware the additional steps are outlined in subsequent screencasts on the support site the reference manual for the zinc ultra skill that i'll be using was easy to find on this island's website and after a quick search i was able to locate create the debug block diagram for the ultra scale displayed on the screen we'll use this diagram to identify the trace components and trace pads for the ultra scale now the first thing i notice is the cortex r five block here and a cortex a fifty three block here the diagram indicates several etms, an etm is an embedded trace macro cell this is the component that generates trace there is one etm per core each cpu and its associated etm is treated as a single element even though the diagram depicts them separately since they are tightly coupled this r five core etm combination is connected to funnel zero the second a fifty three core in etm is connected to what should be labeled funnel? one which is likely a typo as i can see funnel too further down it's not uncommon for a reference manual to miss small details like this but you can usually infer what was intended funnel? one connects to a small on chip memory buffer called in embedded trace pypho or e t f an etap is a trace sink which means that it's a place where you can capture trace data? an eta can be configured as a trace link as well passing data through to another sink you'll note that there's a second etop here presumably etop two where all of the core tray stato is being funneled through funnel two after etf two you can see a replicator replicators propagate data from a single master to two slaves at the same time they are usually passive so for this example, we can ignore it trace component ic is an embedded trace router or etr this is another trace sink where a trace data can be collected and the last trace component the trace port interface unit is the trace output port which is another trace sink now to be able to enable trace and multi we need to choose a trace path a trace path has a beginning point or source and an end point or sink in this diagram, there are actually six trace sources the two r five chorus and their associated etm and they four a fifty three chords with their etms there are also several trace endpoints or sinks the two etfs, the etr and the tpiu these endpoints allow for many potential trace pass between the six cores and there are associated etms that generate trace to one of the four potential sinks where trace data can be collected but not all sinks are available from all course on this target, i could choose a trace path from one of the cortex r fives to the etf, two etr or ptiu i could also set up a trace path from the cortex a fifty three to all of the end points i just mentioned in addition to e t f one, but you'll note that there is no trace path between the two cortex r fives and the e t f one at this point you'll want to choose a trace path if you're not sure which path to choose here are some tips if you're bringing up trace on a target for the first time, it's best to first try the etf closest to the core you want to trace it's the simplest configuration you can use to verify that trace can be generated encapsured as an example, the etf closest to the a fifty three cores would be etf one that trace path consists of your choice of one of the a fifty three cores then funnel one, then e t f one, e t f two would allow you to collect trace from the a fifty three and the cortex r fives now you would probably choose the tpiu trace sink if you have a super trace pro, you could use a trace path from one of the cortex r five course that includes funnel, zero, funnel, two, etf, two and finally the tpiu and you might choose the etr if you didn't have a super trace pro, but you did have target memory to spare now that we've identified some example trace paths we have completed the first of the three configuration steps for enabling trace after choosing a path the next step is to translate that path information as displayed in the green banner into the greenhouse development environment to continue on to step two please check out the list of enabling trace screencasts on the support site at support at ghs dot com。
0亿道电子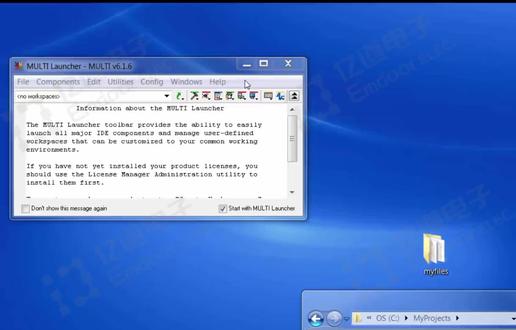 05:47查看AI文稿AI文稿
hello, this is karen welcome to the creating library screencast for multi six one six in this screencast i'm going to show you how to add a library to an existing project using the multi six, one six gooey linked to compiler twenty fourteen one six to begin i select the components menu to launch the project manager then follow me new new top project in the first wizard window i need to give this project a name i'm going to call it karen's lip prodge for karen's library project the directory below asked me where i want it to be located i'm going to place it at my projects karen's libder in the next window i'll choose stand alone as my operating system and generic power as my target this will create a framework for my target platform the second portion of the wizard asked me what i want to create my goal is to demonstrate how to add a library to an existing project? so before we get into the library stuff i'm going to add one of these free package demos to simulate the existing project and then i'll collapse it to create the library i select the add icon if you choose library here it will create an empty library project, but i'm going to choose hello world library for a c which will create a source and header file automatically for me this path sets the source code directory for those automatically created files if you have existing source files that you want to include in your library you can point to that directory containing those files right here i will name name the library project libcarian's demo this determines the gpj file name and the libraries that a file name at this point i have a top project containing target information, a basic demo project and a library project with one hello world source file in its header if i right click and edit the library's project file you can see the wizard created a default directory for my intermediate vials if this wasn't specified the intermediate files would be placed in the current working directory along with the libraries dot a file when you use multi six one six compiler twenty fourteen be careful not to have multiple projects sharing this same directory so far i have a hello library project with very little source code i created a folder containing two files that i'm going to add to this library they find the greatest common denominator and display a fibonacci sequence so my library really has limited use in the real world your files will have much more important code but the process to create the simple library or a more robust library is the same by the way the builder searches for source files in the same directory as the project file and then it looks in any source directories that were configured by the user since my files are in a directory unknown to the builder i need to inform it about my source directory which i can do by right clicking on the top level project file and then choose set build options since i want to tell the builder where to find my source files i'll use the binoculars to search on the keyword source to find the correct option it will show me source related options from which i can choose this source directories relative to this file that will allow me to set the directory to dot dot slash my files which is the folder containing the source that i want to add this will add a line in the dot gpj file with the source in text describe below now i want to include my files in the library project so i highlight the libraries dot j p j file click the add icon select source and then navigate to the my files folder to include those files after that i choose the top project and build now that i have a successful build with this version of multi in the compiler a new dot a file it exists in my current working directory which you can see right here since i've created a new library i need to tell the builder where it's located to do that i select the top level project right, click and choose set build options again i sometimes accidentally set this at a lower dot j b j file so be sure that you're setting it at the right level this time i'll search on a partial library keyword to set a library directory and then i'll choose dash capital l option my new library is located in my current directory, so it's very easy to set if you're using multi seven or compiler, twenty fifteen or newer the dot a file location is changed so please see my creating library screencast for multi seven one four for those versions now that i have a new library i want to link it against my basic debug demo project so i'll highlight the demo project and go to the set build options again you know what if you're not sure which option to set go ahead and select one and the description will be displayed in the lower window if i choose lowercase stachel, i can see in the description that this is the one i want when you set a library directory as we did a moment ago with the uppercase stashell you need to specify your library name in an abbreviated form, so instead of lib karen's demo i'll type the abbreviated karen's demo to link my library once i rebuild i've now linked my newly created library against my basic debug demo project。
0亿道电子 01:35查看AI文稿AI文稿
今天介绍一下 greenhiels 补丁包安装的方法,有时您可能需要一个补定来更新 greenhiels 产品,而 greenhiels 的补定程序可以在官网中进行下载。 在 greenhouse 下,在页面的最下面就可以看到补定程序是通过一个名为 get patch 并且具有指示补丁号的文件。 在这里我们可以看到根据不同的系统有相对应的补定程序。在安装修补程序时要使用最新版本的个 pet 使用程序。最新的 gpet 程序在下载页面的最上面,就在这里可以看到。 下载好补定程序和 gapet 都要放在安装目录下面的 multixxx 目录下,下载好后就可以进行安装了。安装需要进入命令窗口 进行安装。进入命令窗口后,我们进入到补定程序的目录下面。进入到目录下面之后,我们需要运行 the patch 命令, 可以先输入命令个 patch help 查看命令的使用,然后就可以看到个 patch 命令的参数列表。安装的时候就输入 the patch exe target birthcghsmot 七一六 d patch 一六二八四五五六四 gff。 输入命令后就会进入安装页面,这里需要确认是否安装, 输入外就可以确认安装,看到退出表示后,补定程序就安装完成了。好了,本次分享到此结束,感谢观看。
1亿道电子 05:14查看AI文稿AI文稿
hello, this is karen today, i'll be demonstrating a technique to force a program's flow to reproduce an infrequently occurring book i'll start by showing how to enable the profiler to collect coverage data which will identify lines of code that are not being executed which could be one potential cause of a difficult to reproduce bug and i'll also demonstrate two different ways to set a scripted brake point in order to change the flow of execution within an application let's imagine that you've been tasked with tracking down a bug that a customer has reported, but it doesn't reproduce for you you think that it may be located in code that is not executed in your test setup, but that does execute in your customers environment help you using some admittedly very basic code in this hello dot sea file so as to focus on the tech rather than the code i'm simulating a situation where every time i run function a get message on this line returns true, so it never enters the wild loop and i suspect that the customers infrequently occurring bug would be exposed if i could get weight function to run within the wild loop, but so far i cannot prove my theory because i haven't been able to get it to execute in my test case so i'm using the multi profiler coverage feature to highlight places that are not being executed to enable the multi profiler i right clicked on my program and chose set build options i use the binoculars to search on the keyword coverage by double clicking in this window i see more information about which option to choose i want to record whether or not each line of code is executed so i set this field to flag this coverage feature is really useful when you're working with a lot of complicated code and you need to confirm which sections are truly being run everything is set to go so i'll select the debugger icon the go menu and then i'll choose the simulator in the connection choose your window to connect to the target initially i'll let the program run to completion to collect the coverage data after which i will choose the probile option under the debugger few menu in the profiler window i process the data in the coverage section which shows me that there are some uncovered instructions let's go to the coverage tab which list all of my hello world functions if i select function a it shows me which instructions were executed and it looks like line six through eight were not recall that i'm interested in weight function which also has unexecuted lines for this recording it's just a stub where the hypothetical bug occurs now i'll demonstrate how to set a scripted brake point back and function a at line two where the blue arrow is after i hit the spot i'd like to execute the wild loop with a value of zero for head message you can create scripted brake points at the multi command line or by using the brake point gooey i will use the command line for first by typing this b function a pound two sets the brake point atline two a function a when the debugger hits that brake point it will process the commands within the brackets g will move the program counter forward by one line but note you can't set the next execution point to an address sets outside the current function then i'm setting the value of half message to zero then resuming execution so to summarize execution will stop at mine to a function a the program counter will move ahead one line using the value of zero for half message and then execution will resume i can do the same thing using the gooey by clicking the brake point icon selecting new brake point and then adding those same commands in the text box at the bottom the location of the brake point is indicated here now that my scripted brake point is set to force the program flow into weight function where the bug occurs i'll restart the program and you can see from my output that i've executed my stubbed weight function confirming that i force the execution directly to the code where i need to find my customers buck now you'll find that this technique also works quite nicely to ensure complete code coverage invalidation testing because it allows you to force the execution of previously untested code well, i hope that you found this information helpful for more information on the wide range of commands and scripting options provided by multi check out the following documents in your multi installation directory or you can also access them via the help menu well, that's it for this greencast i hope this has been helpful。
2亿道电子 01:09查看AI文稿AI文稿
看好了,这边是有一个按钮的,按进去,然后向里掰,这个就是顶端出水, 来看一下啊,现在来看一下手持,这款手持是幺二零的飞羽,我们看一下手持是如何切换的,同样的往外掰,打开下出水, 拎起下出水这边的按钮,这个是飞羽的雨林式,可以看一下如何切换,切换的按键是在这边一键切换, 这个是也是雨淋式,然后这个是炫动按摩式,可以看一下一键切换,这个是放松肌肉的, 这个就是普通的空气雨淋室,然后关闭的话还是同样的关闭,这里关闭好以后,这边是自己回弹进去的,下一次你需要打开手持的话是同样的操作模式。
378海威建材 04:11查看AI文稿AI文稿
奥克斯新款遥控器操作指引,以下为大家讲解一款遥控器每个按键及功能如何操作。首先装上电池后,屏幕亮起,可以开始操作遥控器,按下开关键,遥控器打开, 此时空调开启遥控器默认自动状态,按下制冷键显示制冷模式。空调开启制冷功能,按下制热键显示制热模式。空调开启制热功能。 按下风速键,可以调节空调风速的大小,风速由弱到强循环依次由自动逐渐增大到强力。根据需要调节 定时功能,按下定时键可以设置空调定时时长,按一次进入调节定时时长状态,此时屏幕中关子开始闪烁,通过加减键调节时间长短,设置定时所需的时间, 再次按下定时键设置成功。图上表示半小时后空调自动关机。 模式选择,此处为模式键,可以选择不同的五种模式,分别为制冷、除湿、制热、通风、自动。 温度调节,通过操作下方加减键可以调节设置温度的高低,设置用户需要的温度。左右摆放功能, 此处为左右摆风按键,按一次空调,开启左右摆风功能,再按一次空调,关闭左右摆风功能。上下摆风功能,此处为上下摆风按键,按一次空调,开启上下摆风功能, 再按一次空调,关闭上下摆风功能。菜单确认键,按下菜单确认键,可以选择屏幕中显示的不同功能,若需要设置某种功能时, 首先选择对应功能,如健康功能,此时屏幕中健康字体开始闪烁,再次按下菜单确认键,健康功能设置成功, 通过操作圆环上下左右四个按键可以选择其他功能,如设置睡眠功能,按下右键至睡眠处,睡眠字体开始闪烁, 此时再次按下菜单确认键,睡眠功能设置成功,其他功能同样操作方式。 那屏幕下方功能如何取消呢?如取消睡眠功能,按下菜单确认键,通过左右键选择到睡眠字体处,此时睡眠字体处于闪烁状态,此时再次按下菜单确认键, 取消成功,此时已取消睡眠功能。其他功能是同样操作方式。 辅热功能,辅热功能在制热状态下,根据环境温度自动开启关闭,若需手动开启关闭 制热模式时,按下菜单确认键,选择辅热字体处,再次按下菜单确认键,即开启关闭辅热功能。铜锁功能,同时按下制热模式键三秒,空调开启铜锁功能,此时空调面板锁定, 再次同时按下制热模式键三秒,空调关闭铜锁功能。其他功能,遥控器关机状态时, 按下菜单确认键,屏幕出现屏显加湿清洁可供选择。开启关闭操作与健康睡眠功能操作一致。
640凡事留一线,日后好相见。 01:05查看AI文稿AI文稿
讲一下这款弯把的这个刹车把手和变速把手一体的这个使用方法啊。首先我们在骑行的过程中, 左手的话是控制前面变速的,而左手他是有两个半档,他外边的话这个是加档,我们需要按一下, 摁两下,然后这个是可以摁三下,摁三下以后,那现在在已经在最大齿轮了啊。然后里边的这个是减档,里边这是减档,然后拨动它,摇动踏板,再按一下啊,再按一下可以了。 然后右手边右手边是拨一下一个档啊,然后现在拨动,看后面的档位变化,外边的这个大的是减档,因为齿轮越大的就是速度越慢。 然后里边的这个就是加档啊,尺寸越小速度越快啊,我现在按快一点啊。
106D13752223889 05:36
05:36 01:52查看AI文稿AI文稿
惠普电脑易管家软件的使用方法,找一下惠普易管家软件的使用方法。首先大家打开屏幕左下角开始菜单,找到易管家超级版这个软件,大家双击打开, 打开之后大家会看到左侧有个工程师列表,前面前面这几个带有绿色小圆点标识的代表是在线工程师,大家随便点开一个就可以。然后大家在对话框里边输入咱们需要解决的问题,比如说大家需要解决的问题, 在对话框直接留言给工程师就可以,工程师就会接管咱们的电脑,咱们在此需要点接受,如果大家需要有隐私的东西需要设置的话,大家可以设置,我的电脑里目前没有隐私,我就点放弃保护就可。 现在工程师就已经接管了咱们的电脑了,帮咱们来下载这个 qq, 除了 qq, 比如说,呃,咱们可以请工程师帮忙的,可以帮咱们电脑分区,帮咱们装打印机驱动,帮咱们激活正版的 office, 或者是帮咱们把这个软件下载下来了,现在要帮咱们安装整个过程,不用咱们 有任何的操作啊,工程师都可以帮咱们顺利的下载安装。而且咱们这个易管家软件是二十四小时全天候都有工程师值班,这样的话就是咱们在二十四小时之内,就是在全天候无论遇到任何软件相关的问题,咱们工程师都可以帮咱们解决,非常的方便。 这样工程师帮咱们下载安装,整个过程都已经结束了,就是帮咱们解决了咱们这个明确的这个具体的 问题,这样咱们就可以退出整个程序了,然后工程师可能会要求咱们这是一个评价,如果咱们满意的话,直接呃,咱们按自己的真实的体验直接评价就可以,这样咱们整个过程就结束了。
394亢山苏宁易购 04:30查看AI文稿AI文稿
有时候一块大的松下直接可以把你给送走,陪你一辈子,我是万万没想到啊,周老师,为什么我的琴拉不出声音来,这个问题竟然是大家问我最多的,都怪我,是我没教好,是我没说清楚,这一次我给大家来一个, 哈哈哈,这,这都怪我自己啊,我给大家来一个终极版的保姆擦松香教程。首先我来说一说为什么要擦松香呢?以及我们为什么刚拿到的新工和小滤芯拉不出声音来呢?因为这个功毛 在没有擦松香之前,他是很光滑的工具,擦松香也是为了增加我们这个工毛的摩擦力以及进行震动,从而产 声音。那么弓呢,首先要拧紧啊,不能够在弓完全弓毛是松的情况下去藏, 擦松香那是不行的,也不太方便啊。我们把弓下面的这个螺丝拧紧,到弓杆和弓毛平行,我们再去擦松香,我们可以看到新的松香,他的外表是非常的光滑的啊,包括我来说一下,松香千万不要掉在地上,他是非常容易摔碎的, 它的质地呢,就像一块糖一样,掉在地上就非常容易的碎。为了更加方便的能够擦上去,我们可以用我们的这个公感的这一块金属这一边呢去, 哎,给他划几刀,哎,哎,我划成这样了之后呢,就会比较好擦一些了。然后呢,我们从攻坚开始擦,这个时候呢,我们 拿住攻坚这一端,先从攻坚开始也可以,嗯,松香动弓不动, 擦了的地方呢,他颜色就浅很多了,明显可以看到有一层粉末在上面。擦完攻坚我们再来擦公跟,那公跟就要小心了,因为我们的这个公跟这一块呢是金属,非常容易呢就把松香给撞碎了对不对? 所以我们在擦公跟这一块的时候,要捏住公跟这一块,然后再擦中间,这样就很方便了,力量大一点会更加容易擦上去一点。一开始在擦的时候呢,不需要擦的区太大,先从小的地方开始,慢慢的扩散到整根过。 哎,大家都会出现的情况出现了啊,新工工毛断了啊,剪刀或者说是指甲剪去把它给剪掉,单 我也可以把它手掐住这一块,然后我再扯掉也行的,但就是会留一个头在擦的时候呢,施加压力,让这个勾毛完全的贴合压在松香上, 这样我们呢才能够好擦,当然你也可以就是拿着松香这样去擦也是可以的,第一次呢,我会擦的比较多,然后以后我们在练琴之前,然后就来回擦个八下十下左右就可以了,不易擦的太多,擦太多的话呢,掉在琴上就会难以清理。这个 松香粉呢,它是有一定的粘性的,我们可以检查一下啊,这里还有一些没有擦到的地方,再把它擦一擦好,这样的话呢,我们的整个工松香就都擦好了,你就可以愉快的进行练琴了。以及我还要说啊,练完琴之后,大家记得把这个弓给 松掉啊,不然的话,我们这个弓一直紧绷着,他就会失去韧性了。最后呢,有同学又会问了,老师,我的松下就在刚才摔到地上,掉在地上摔碎了怎么办呢?教大家一招,我就不掩饰了,你可以用打火机把 摔碎的松墙当然摔成粉碎的啊,你就算了吧,你就放过他吧,还裂成大块的,你可以用打火机烫一烫,然后 把它粘起来,离远一点啊,你不要直接去烧啊,靠近火的表面。然后呢,你再看着他,如果稍微融化了,然后我们就赶紧把 把这几块黏在一起,这个时候呢,松香是可以融合在一起的,我们还可以拯救回来,继续为我们服务。这个松香 真的是非常的耐用,所以这也是为什么我会喜欢收集松香,有时候一块大的松香直接可以把你给送走,陪你一辈子。 说起来有一点吓人好,大家不要再问我为什么我的小提琴拉不出声音来了,就看这个教程,记得给我点赞,嘴巴都说干了。
1.6万周老师的小提琴


猜你喜欢
- 172秋风