平安证券手机k线设置布林线设置

粉丝1.7万获赞3.2万
相关视频
 04:38查看AI文稿AI文稿
hello, 大家好,欢迎回到 k 线课堂第二十一节趋势性指标布林带,布林带里藏着三个赚钱密码您知道吗?准备好了吗?发车了! 最近啊,我们给大家也介绍了不少的指标,而且他们个个都有必杀技,今天再趁热打铁给大家介绍一个趋势性指标,布林带。 那究竟是什么布林带呀?布林带也叫布林通道,在行情软件中标注为 b、 o、 l、 l, 在各类指标中,它的辨识度啊可以说是极高的了。 布林带是由上轨线、中轨线、下轨线三条线组成,其中上下两条线分别可以看成是价格的压力线 和支撑线,在两条线之间的是一条价格平均线,一般他的默认参数为二十,其实就是二十天的移动平均线。 通常来说, k 线会在布林通道里面运行,且通道的变化会随着 k 线价格的变化而自动调整位置。 简单的说,这条带状区的宽窄是随着股价波动幅度的大小而变化的,股价涨跌幅度加大,也就是市场波动激烈的时候,带状区变宽,涨跌幅度狭小盘整,也就是市场平静时,带状区则变窄。 如果记不住两者的关系,可以想象河豚在简单了解布林带之后,我们继续来介绍他的神 技能要怎么运用。技能一,通过开口、收口判断走势,当价格走高时,布林蛋会开始扩张,也就是开口 预示着价格异常激烈的向上波动即将开始。反之,当价格走低时,布林带也会扩张,开口,预示着价格异常激烈的向下波动将开始。 布林张口,价格继续走,当布林带开始变窄,也就是收口行情会朝着相反方向运行或保持震荡。 我们看图价格走高,且布林带开始扩张,也就是开口行情迅速向上大幅波动,当布林带开始收口时,行情开始震荡整理。技能二,通过 三条线的运动方向判断走势。当布林带的三条线同时向上运行时,表明价格强势特征非常明显,价格短期内将继续上涨。 当布林带的三条线同时向下运行时,表明价格弱势特征非常明显,价格短期内将继续下跌。三线齐头并进,行情继续前进,下面我们来看一下齐步走的力量。 看图,布林带的三条线同时向上运行,表明多头行情非常强烈,行情也果然一路向上。 技能三,通过价格的突破判断买卖信号。布林带的三条线时刻扮演着支撑和阻力的作用,而价格通常倾向于回归至布林带的 中部,特别是在盘整阶段,当价格运行到布林带上轨的时候,就会向布林带中的中轨返回。同理,当价格运行到布林带下轨的时候,也会向布林带中轨的返回。 从图中可以发现,在盘整行情中,当行情来到布林带上轨时,会受到明显的压力,当行情来到布林带下轨时,会受到支撑作用,而无论价格往哪里走,最终都会往布林带的中轨靠拢, 有压力支撑的地方就一定有突破。所以,当 k 线从下向上突破不零线中轨线时,预示着价格的强势特征开始出现,为买入信号。当 k 线从上向下跌破不零线中轨时, 就预示着价格的弱势特征开始出现,为卖出信号。好了,那么到这里啊,布林带就讲完了,关于指标的介绍,我们也要告一段落了, 建议大家在熟练的掌握基础上,将多个指标结合进行判断,组成自己的交易系统,这样做交易起来会得心应手。这节就到这里,咱们下节再见。
200百科财富思维 14:35查看AI文稿AI文稿
in this video i'm going to show the top five bolinger band secrets that i learn after many years of studying the financial markets like i said in the video about moving average secrets you'll find many people who will charge you for this level of information, but i believe this to be basic enough to be given away for free if you haven't watched the video about moving average secrets i encourage you to do so because bowlinger bands are an indicator that builds on top of moving averages, so it's a good idea to have a good grasp on the fundamental properties of moving averages first that said let's move on to the first bowlinger band secret secret number one the meaning of bullinger bands many traders have the habit of bloody indicators and lines on a chart without really understanding the origin of such lines and their meaning that's certainly the case with bowlinger bends the bowlinger bends indicator is composed of three lines the center line is a movie average and the two outer lines are moving standard deviations of price in finance standard deviation is a measure of volatility in other words bullinger bands indicator attempts to model the volatility of price given a certain number of past periods, but that said we have to understand the meaning of standard deviation since it's the core component of the bullenger band's indicator as the name suggests the standard deviation measures how much the data points stretch away from the mean of data points in this illustration, we have two examples that indicate the standard deviation when data points don't stretch too much away from the mean, we have low standard deviation when a data points do stretch away more abruptly we have higher standard deviation just for curiosity below we have the formula for the standard deviation, but we are not going to detail on that in this video since we are only interested in the rough intuition about standard deviation for now by looking at these two situations we can sort of understand why the bowlinger bands is a volatility indicator when prices come and audivating too much from its mean the bowlinger bands will be narrow when prices volatile in showing a lot of powerful movements the bowlinger bands will expand the bottom line about standard deviation in the paradigm of bowlinger bands is that narrow bands mean low volatility and wide bands mean high volatility when paramount detail here that you must never forget is that since bullen jabens are built on moving averages and moving standard deviations they have lag that means that if the bullen jabens are displaying high volatility at the moment with wide bands that by non necessarily reflect a current moment since it's an average of past periods this is the old problem of lag we talked about in the video about movie averages in this chart, we can see a good example of how narrow and y bands reflect the market volatility on the left the narrow bands reflected a rather calm market after a while rice exploded to the upside and that made the bowlinger bands expand also notice that there is some lag in the way they expand since bowlinger bands are built using moving averages and moving standard deviations secret number two the empirical rule in statistics the next secret i want to show you is related to something called the empirical rule in statistics you'll probably already noticed that the standard setting for bone your bands is two standard deviations from the mean that's actually one of the very few places in tactical analysis, where numbers are nar randomly or arbitrarily chosen in this case, the motivation for using two standard deviations from the main is the embarical rule in statistics the empirical rules states that assuming we are talking about normally distributed data sixty eight percent of the data will fall within one standard deviation from the mean ninety five percent of the data will fall within two standard deviations from the mean in ninety nine point, seven percent of the data will fall within three standard deviations from the mean the fact that bullinger bands have a default setting of two standard deviations from the mean is because the indicator was built to show movements where price stretches too much away from the mean with a certain degree of frequency it's much easier to understand what all of that means by using a chart example in his first chart, i plotted a bowlinger bands indicator, but i altered the number of standard deviations to one according to the empirical rule when we use one standard deviation from the main only sixty eight percent of price will fall within the bolinger bands just by looking at the char, we can more or less observe that this makes sense roughly sixty eight percent of price is captured inside a bowl intervention in the second chart, i altered the number of standard deviations to two this is the default setting of the balloon jar pans indicator and according to the imperial lyrical rule ninety five percent of price falls within the bowlinger bands we can see that this is more or less correct because most of price action is captured inside a bowlinger bands there are only a few places where price goes out the limits provided by the two moving standard deviations in the third chart, i altered the number of standard deviations to three notice that now there are even last places where price goes outside the boundaries established by the moving standard deviations this of course agrees with the empirical rule which states that ninety nine point seven percent of data will fall within the three standard deviation from the mean the use of this is pretty intuitive when price goals outside the boundaries provided by the moving standard deviations it means that it stood stretched away and it will tend to reverse the additional detail that not all traders know is that it's one thing when price goes out the two standard deviation barrier and it's another when price goes out the three standard deviation's barrier according to the empirical rule price going out three spender deviations from the mean is a much stronger and rarer event you tend to notice that most of the times that price goes out the three standard deviation barrier it will reverse at least a little bit when two standard deviations are used you observe that price will continue going outside the boundaries in many cases this leads us directly to the third secret about bowlinger bends secret number three the reverse ability property while we learned in the second secret about bollinger bands regarding the empirical ruling statistics gives rise to the third secret, we're going to talk about which is the behavior of price in relation to the moving standard deviations we already talked about the rough intuition of what standard deviation means the reverse ability of price is how likely price is to reverse at a certain point in the chart for example when price surpasses the upper or lower bull in your band has a chance of reversing back to the mean because it is too stretched away from the mean like we observed in secret number two the higher the number of standard deviations the less likely it is that price goes outside the bowlinger bands in a particular case of the bowlinger bands there are optimal numbers for the standard deviation if the trader uses two standard deviations from the mean price will often go outside of boundaries if the trader uses three standard deviation from the mean the number of times that price go out of the bowlinger bands will be reduced however, when price does go out the bowlinger bands it will have a bigger chance of reversing at that point in this chart, we can see an example of this reverse ability property i'm talking about i plotted two bullenger bands on top of each other one of them has two standard deviation from the mean, and the under has three standard deviations from the mean, the orange channels show the space in between the second and third standard deviations in the first arrow marked in the chart, we can see that price goals outside the boundaries represent by the bullencher bands with two standard vations from the mean notice that price doesn't reverse immediately in the second red arrow, we see price going outside the boundaries established by the bullinger pants with three standard deviations from the mean once price closes beyond that level it immediately reverses it back to the mean, it's important that you understand that this doesn't always happen on the right side of the chart, we can see another example rice does break out the two standard deviations barrier, but it's not until it breaks its three standard deviation barrier that it starts to reverse back to the mean as it is shown by the green arrow the takeaway from this third secret about bowlinger bands is that the hired a number of standard deviations price breaks out of the more likely it is that it will reverse back to the mean even though that makes sense statistically speaking there are more pernicious problems that get in the way of this property of price one of these detrimental problems is related to the fact that price charts are non stationary, which is the subject of the next secret about bowlinger bands secret number four the problem of mean reversion in non stationary time series the first strategy that comes to mind when we think about bullenger bands is assuming that price will reverse direction when it surpasses one of the outer bands and will reverse back to the center movie average as we saw in the third secret, the bigger, the number of standard deviation surprise stretches away from the mean, the more likely it is that it will immediately reverse back to the mean, this is known as a me reverting strategy however, there is a fundamental problem when we try to apply this strategy in price charts price charts have the property of being non stationary, which means that they have variable mean and variable standard deviation another way of looking at this is that price charts have trends that change continuously by definition me reverted strategies only work well on time series that are stationary we need those who have constant being and constant standard deviation a stationary time series looks like a sideways market and any mean reverting strategy only works in such a scenario because the series continues to be stationary in any price shark the market alternates between sideways movement and trendy movement in a rather unpredictable way so using a meme reverting strategy is a bad idea in this chart we can see that price was in stationary mode inside the grain box we need that it was a sideways market that is how the meme reverting strategy will work perfectly well in this case because we have a flat mean and a flat standard deviation in the second chart we can spot the problem of me reverting strategy in non stationary markets the first green box we can see that price escapes the boundaries outlined by the bullenger bands so the trader could think it would be a good idea to buy the market with the hope that he reverses back to the mean here's the critical point about this price will always reverse back to the mean, but the problem is that in non stationary or training markets the mean will also move so by the time price reaches the mean again it will be in a different position and our loss will occur in the second green box we can see that pricing did reverse back to the mean, but since it takes time for price to do that and the mean was going down due to the fact that the market was training now by the time price reached the mean it would generate the loss instead of a profit very much like the problem of finding the optimal moving average periods where across over strategy the trader can never truly know when the market will shift between sideways and trending modes to make a simple analogy training a meme reverse strategy in a non stationary price chart is like trying to score a goal with the moving goal posts by the time the ball reaches the goal, the goal post will be in a different position and you will miss the goal completely secret number five bolinger bands as dynamic support and resistance another use of the bolinger bands is as dynamic support in resistance very much like in the way that was demonstrated in the videos about moving average secrets the outer lines and the center line of the bullen jar pan's indicator can all act as dynamic support in a resistance this already opens up several possibilities because there are three powerful settings that can be used and that i agree with the empirical rule we talked about previously the settings are of course one, two and three standard deviations one important detail is the angle of the moving standard deviations when the moving standard deviations are going against price they tend to provide stronger barriers when they are going in the same direction as price they tend to represent weaker barriers the flat angle in the moving standard deviation works in a less intuitive way because a flat angle will usually mean a sideways market so the barrier will be strong even though the angle isn't steep all of these details regarding the moving standard deviation angle are just guidelines of course it doesn't always work that way this chart we can see how the moving standard deviations can work as barriers for price as it is highlighted in the red circles an additional trick we can and using certain situations is visualizing the bullet jabends from other time frames to see if there are any barriers for price in this chart i plotted two warranger bands the red one is from the native one hour chart and the black one is from the four hour chart in the green boxes, we can see movements where price was interacting with the moving standard deviations from both the one hour chart and the four hour chart that will be additional strength to the idea of treating bullinger pens as dynamic support and resistance lines however, before you attempt to transform this into a strategy keep in mind that it's not so simple as observing why the lines correlate there are many more aspects you would need to consider in order to transform this into a strategy, but this is a subject for another video i hope you learned something new and useful with this video。
12嘉实诚业 07:51查看AI文稿AI文稿
全国粉丝朋友大家好,最近有一阵子没有更新了,那是因为我在等行情的低点,现在等到了啊,说到这个,大家可以先点点关注,以便之后去做验证,我们录制这节目的时间是十月二十三, 关注之后你就可以很好的做验证,而且回看,不是吗?还能够收到最新信息,我们来看一下哦。其实哦,如果你单看 k 线的走势,看不出来为什么嘞?因为不管你 之前学的是什么样的分析方法,这种走势都还是看空的走势,因为你看嘛,如果说你用排列组合,那这个是连续四个黑 k 啊,在形态学叫这个黑三兵,或者是这个黑士兵四个黑 k 嘛,好,如果说你 用形态学来说的话啊,他这个破支撑线呢?因为你看这边是一个平台嘛,他破平台,所以是看空啊, 好,如果说你用趋势的话,哎,这个一再破底啊,所以这个都看空了,所以说你不管怎么看,这个都是空投。但是今天我教大家用另外一招来看,哪一招呢?就是用不零线来看 b、 o、 l、 l, 请注意哦,今天讲的是比较高阶的用法,所以你看到最后你会发现到不零线原来可以这样子用。我先说一下了,不零线一般怎么用, 一般不零线来讲的话呢,就是碰到他的这个下轨就是支撑就会反弹啊,碰到上轨,像我们这边标注 a 的地方,这个就是压力就会往下掉,这是一般不零线的用法。然后呢,如果再进阶一点的话, 会告诉你说啊,若跌破的话,缺口打开,通道打开啊,这个就是形成下跌趋势啊,像最近就是下跌趋势啊,这是一般教科书比较稍微在进阶的用法,但是除此之外就没有了。 不过我们今天这节目要跟大家讲到更深的东西,所以你要听仔细,有看到最后你会吓一跳,就是哦,你有没有发现到玻璃线,他如果说往下通道打开, 他有两种打开法,一个是什么来请看一下。一个是他沿着这个下轨往下打开,有没有。大家看一下我们这个蓝圈标注的地方, 他是不是守在这个轨道内,然后往下打。好,类似这样的状况其实常常发生,我们稍稍说 缩小看一下,像是在这段期间,他是不是也是沿着下轨往下打开通道? 那你对照一下,那跟现在的状况哪里不一样?我们把这边啊,就现在状况我们叫做 a, 当时的状况叫 b 啊,还有之前这边这个状况我们叫 c, 请你对照一下, a、 b、 c 哪里不一样?我们这边放大来看哦, 你有发现到差别在于说,他虽然说是往下打开通道,但是他是叠到轨道外面的往下哦, 前面这边我们用红框圈的地方,他往下打开通道是沿着轨道往下哦,但是我们现在蓝框这个位置,他是在下轨 以外轨道以外的往下哦,这个哪里不一样?各位,红框这个地方可以叫做温水煮青蛙,就他往下叠,但是叠的幅度没有很大,这个反而比较危险,因为水煮青蛙最后叠到头之人不知不觉回过头去看, 再回头一百年生,所以这个是很贼很狠的一种叠法。好,那这种呢?蓝色的这种呢? 虽然看起来表面上好像更凶悍,因为叠还叠破了这个趋势线,叠破了下轨线嘛,但往往这样子更能够以叠直叠, 为什么呢?因为哦,一旦跌的比较快,是不是更容易引起散户金黄,所以更容易 清洗完筹码,那在以像这个物理学来讲的话,也更容易形成物极必反。所以布林线更高阶的是可以这样用法,你看他的叠法是怎样的叠法, 如果他叠把是沿着轨道这样叠的,那可能绵绵无绝期,但如果说他叠的是叠到轨道外,那很快就要见底。关于这一点,我们可以看一下历史经验,我们把 k 线图缩小缩小,缩小缩小好,我们可以看得很清楚,像这一段 我们用蓝色框来看,像这一段就是沿着下轨往下掉吗?所以是不是叠了很长一段?这一段也是沿着下轨往下掉,所以说我们看到这边是都叠了很长一段,但是请注意哦,但是请你看一下我们现在蓝色框框的地方,就是这边, 我们用蓝色框框起来就是这边啊,还有这边,还有 这个这两个位置,这边三个位置,大家请看一下,他们当时在沿着下轨往下叠的时候,那个真的都继续再往下掉,压力确实很大 啊。这边确实压力很大,但是一旦出圈出框了啊,大家看我们圈起来的地方,我们写 a 的这个地方,一旦出圈啊,出框了,哎,反而就要开始长了。 这边也是,一旦跌破这个轨道外了,哎,反而就要开始涨了,一旦跌到轨道外了,哎,反而就要开始涨了啊。关于这一点,我们可以放大看的更清楚,我们把这个蓝位点进来,然后 血区域放大有没有?各位,你看他沿着这个轨道走的时候,那真的是绵绵无绝奇,一路跌,但是当你出圈呢,跌到轨道外了,反而就要涨了有没有?当你沿着轨道跌的时候,反而绵绵无绝奇,可是当你出圈呢,跌到轨道外了,哎,反而要涨了有没有? 这三个位置都一样啊,所以我们再回过头,看到现在指数的位置,哦,指数的位置就是什么? 就是出圈了,叠到轨道外了,之前沿着轨道拉直下叠吗?但现在已经出圈出外了,所以参照历史经验哦,这边随时就要往上涨 啊。这样子的不零线的教学方法,你应该是没看到,因为我也看了很多书,书上没有讲到这个书上只会讲上轨是压力,下轨是支撑啊等等之类的, 没有讲到。其实啊,他的通道打开有两种,一个是在轨道外的,是在轨道内的,所以你举一反三呢。如果说有一档股票, 他是沿着上轨往上走,那我告诉你,恭喜逮到腰鼓,逮到黑马,你就大胆坐着啊。如果说有一档股票,我们假设这条红色的线是上轨哦, 啊,如果有一档股票,他上涨,哎,是冲到冲到圈外的,冲到轨道外的,那你要小心,他可能随时要涨多回档啊。那这时候你就要以这个上轨来当做支撑啊,如果跌破支撑,你就要该壮士断腕,该卖就要卖 好。所以说我们教的是方法,可以应用在个股,可以运用在指数,那因为平台的关系,这是政策的关系,没办法。再一次, 里面讲个股讲的太细,所以欢迎对个股有兴趣的同学可以在评论区留言啊,不要私信,私信我收不到,你用留言的方式我会一一的去关注,一一去说回复。好了,以上分享 如果觉得对你操作有帮助的话,记得点赞,以便接收最新资讯,我们下个视频见,拜拜!
78台北股民在天津 00:23查看AI文稿AI文稿
当黑线处于不灵线中轨线下方向上突破不灵线中轨压力位时,预示着市场的强势行情开始出现。 当黑线站稳不灵线中鬼支撑位,向上突破不灵线上轨压力位时,预示着市场的强势行情已经确认。当黑线向上飞跃不灵线上轨压力位时,如果不灵线的上、中、下三轨运动方向也同时向上,则预示着市场的强势特征依旧。
199龙哥侃市 00:27查看AI文稿AI文稿
东哥来分享,今天来说一说天线,平常我们打开证券 app 或者应在手机推送理财广告,你有没看到一条花花绿绿的线,这条红绿交替的线是什么东西呢?这就是传说中的天线。这玩意起源最早于日本,是交易的时候用来计算每天的涨跌的,因为他的画法很特别,后面就被引入到 股票市场交易走势分析中,称作 k 线图,要交蜡烛图、日本线、鹰眼线、棒线等,常用的说法是 k 线。
 05:22查看AI文稿AI文稿
k 线是看懂行情的基础,行情是涨是跌, k 线会告诉你,这就好比人们的性别,当一个人站到你的面前,你就立马可以判断是男是女。而学会了 k 线,你也能做到一眼看涨跌。 k 线主要分为两种线,阳线和阴线。阳线通常代表上涨,阴线通常代表下跌。 在国内,阳线通常用红色表示,中国人喜欢红红火火吗?而阴线则通常用绿色表示,当然还是中国人不喜欢绿色。呃,这个你懂的啊。 在实际的看盘软件中,阳线也会以空白表示,而阴线也会以黑色表示。 k 线由上引线、下引线实体组成,包括开盘价、收盘价、最高价和最低价。这就像每个人的身体器官一样,在分得清男女之后,也就是阳阴线之后,同样要认识身体的每个器官,注意男女有别哦! 了解了 k 线以后,我们再来看一下 k 线的几种形态,没有一种 k 线的形态不能用男女之间的拔河。说明清楚了, 男女之间的拔河是男女之间的两股力量的较量,而 k 线的形态则是多头与空头两股力量的较量。 如果把多头力量当做男生,空头力量当做女生,那 k 线的问题就迎刃而解了。 k 线形态之一,光头光脚阳线, 这种阳线没有上引线,下引线,开盘即是最低点,收盘即是最高点,代表了多方力量强势后是继续上涨的概率比较大。 就像我们在拔河比赛中,男生一队,女生一队,男生队一路领先,结果完胜女生队。男生代表多投,女生代表空投,男生以压倒性的优势战胜女生,说明多投力量大。 k 线形态之二,光头光脚阴线这种阴线同样没有上引线,下引线开盘即是最高点,收盘即是最低点,代表空方力量的强势,后是继续向下的概率比较大。同样,我们拿拔河比赛来 说,在拔河比赛中,女生一路领先,结果完胜了男生。男生代表多头,女生代表空投。女生以压倒性的优势战胜了男生,说明空投力量大。 k 线形态之三,锤子线此 k 线通常出现在价格连续下跌的相对低位,表明下方支撑较强。 k 线实体较小, 位于 k 线的顶部位置,带有长度大于实体两倍以上长度的下引线,阳线或阴线均可,阳线的底部反转信号更强。 如果这根线是洋线,说明在拔河比赛中,女生虽然来势凶猛,一度很强,曾遥遥领先,但男生没有放弃,经过顽强的拼搏, 男生反败为胜,最终男生小胜。男生代表多投,女生代表空投,说明多投力量更胜一筹。 如果这根线是阴线,说明在拔河比赛中,女生来势凶猛,一度遥遥领先,但经过顽强的拼搏,男生拉回了一大截差距,最终遗憾小负。男生代表多头,女生代表空投,说明空投力量略胜多投。 k 线形态之四,倒垂的线多出现在价格连续上涨的相对高价区, 表明上方压力较重。 k 线实体较小。位于 k 线底部位置,带有长度大于实体两倍以上的长度的上顶线、阳线或阴线均可,阴线 的顶部反转意味更浓。如果这根线是洋线,说明在拔河比赛中,男生来势凶猛,一度遥遥领先,但可惜后劲不足,女生强势反击,最终仅仅小胜女生。男生代表多投,女生代表空投,说明多投力量略强。 如果这根线呢,是阴线,说明在拔河比赛中,男生来势凶猛,一度遥遥领先,但女生后尘发力,力挽狂澜。最终啊小声男声,男生代表多头,女生代表空投,说明空投力量略强。 k 线形态之五十字心线十字心呢,就是开盘价和收盘价一致,并带有上下引线表, 表明多空双方在这个位置势均力敌,观望情绪浓厚。在拔河比赛中,男生和女生势均力敌,拔来拔去也没有分出胜负,最后以平局收场。 男生代表多头,女生代表空头,说明多空力量均衡。
1.0万百科财富思维 05:10查看AI文稿AI文稿
大家好,我是长虹,很多朋友说 ktj 指标用起来不准,那是你没有用过我的参数,更改参数过后的 ktj 用一次准一次,大家一定要仔细把这个视频看完,下面我就把这个参数分享给大家。 首先把 kdj 的组成以及金茶与屎茶快速的给大家讲解一下,因为很多新股民朋友啊,还不知道看到视频做这个食堂跟相对应的 k 线,白色线,地线,黄色线接线紫色线。第一点, kdj 天叉和时差分别称为黄金交叉和死亡交叉。 颗粒结,金叉是指颗粒结有指标中白线从下上传黄线形成的一个交叉, 叫做金叉,那么金叉代表买,可以见死叉是指紫色线和白线同时呢向下突破黄线形成交叉的一个情况,这叫死叉,死叉表示卖,旁边的数字零到一百是什么意思呢? 是代表 ktj 在上中下的一个位置,这个数值零到二十是超迈区域,也就是不能再卖了,行情就要反弹了。八十到一百是超迈区域,也就是不能再买了,行情就要下跌了。 跟这些黄金交叉发生在二十以下是最佳买点,如果跟这些死茶发生在八十到一百之间,八十以上,那么呢就是最 一家的卖点。搞清楚 ktj 的使用方法了,接下来进入最重要的环节,更改参数。怎么来更改?随意点击一根 k 线,单击鼠标右键点击一下调整参数指标,我们系统得到 ktj 指数为九三三, 而九三三呢,这个参数经常会出现假,经常和假时差,误导咱们买卖股票的时机,经过我多次实盘检验,把参数改为八十九 十二,这样参数的一个暴力 k t j, 那么就可以有效的规避假金叉和假死叉的一个问题,而且也非常容易 抓住起爆点,点击一下硬数位作周期,那么就可以更改成功了, 接下来让我们一起来验证一下我的参数,见证神奇的现象。这次股票当 ktt 的接着在底部凌迟附近成弧形的形态向上反弹的时候啊,那么这个时候往往浴室后面有一波大的行情, 三次反弹,三次机会,两次涨幅超过百分之百,一次百分之四十, 非常的强势,要注意这样的买入点还不是起爆点,不排除或者上面呢,横盘只能在拉伸,这个就是底部弧形买入的法则。 我们再来看一次股票更改成熟过后的 kdj, 他的坚持在凌迟附近 成弧形状态向上反弹的时候,那么这个时候呢,后面的行情大家可以看见涨幅超过百分之百,所以说更改参数过后的这个 kdj 啊,大家可以对照自己的盘面去验证一下。 那么怎么卖股呢?下面教大家什么时候卖当这只股票啊,他的阶级在高位八十到一百附近的时候, 很难拐头向下的时候,不管后面长还是不长,先第一时间出来,出现这样的形态,大部分都是阻力要出后了,注意一般出现这样的形态呢,都会在 高位横盘几天,我们一定要及时规避风险。我们再来看一次股票坚持在高位八十到一百附近横盘拐头向下,那么上面的行情呢,也是对应的,会进行一个回路, 所以更改参数过后的 kdj 麦谷也是非常准确的,朋友们,是不是很简单呢?重点在于参数参数才是准的原因, 一定要对着实盘去理解,去标识,实战中啊,多去应用。现在的股市呢,也不是一帆风顺了,不再像以前一样闭着眼睛就能赚了。 乱世出英雄,股市也是一样,如果你能够拥有一套自己的一个盈利模式和操作思路,那么在股市中就能拥有一番事业。
193有股长宏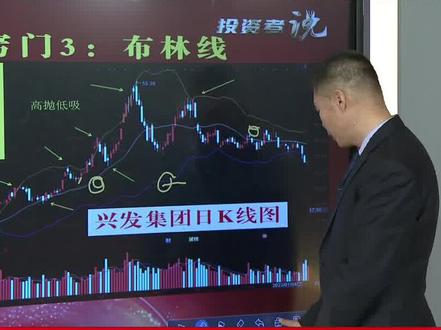 01:27查看AI文稿AI文稿
当然很多人可能还是不满足,我还芝麻也要,西瓜也要,哈哈,就是布林县他也有这种功能,就是什么呀?就是在上升趋势当中,在上轨线和中轨线的这个买卖啊, 遇到上轨线打到上轨线,你看上轨线,遇到上轨线,一般两个该跑就跑,都是压力位,对上轨线压力,你要是逢高迈出,大家记住啊,这种逢高迈出, 别上我县,卖了我就,然后我就全仓卖,然后到中国有全仓卖,不要这样,就是大仓位,在第一位买入之后,你肯定是要做趋势,但是这种高抛低息,大家记住啊,用小仓位高抛低息,也就是拿出 你这个总仓位不超过三分之一的筹码去做高抛低息,降低成本啊,不要去全仓,全仓你也很容易在这我卖卖卖空了之后,他就直接起来,也有这种现象,大家注意,这个方法我认为大家 一定要学会,而且要经常用,为什么?因为以后真的注册制来了,这个真的是不好,或者遇到利空的股票,他会什么呀?一天会跌百分之二十, 如果你要是没有足够的这个安全垫的话,嗯,你这个比如说我高位买了我奶奶挣了几天钱,啪一根杂音,全全套牢,是吧?哎,所以大家一定要学会,要会打这种安全垫了,哎,你这股票已经脱离成本,比如翻一倍了, 百分之二十,两个百分之二十也达不到我这个成本啊,所以说我认为以后这种高抛低息,大家也要多多用。
128BRTV 天下财经 53:16
53:16 03:08查看AI文稿AI文稿
哎,大家好,现在我在录个视频啊,录个那个通达性手机办软件如何去去安装个公司啊,然后如何选股?点开啊, 那我们就点任意一支股票,点任意支股票,点到可以这个日可以先去啊,点到日可以先去的话,大家就点在这个位置,这里是指标名层的位置 啊,这里是,呃,刚才点错了啊,指标名称的位置哈,这个位置也找到了,找到了个我的指标,然后新建指标,新建指标的话你把你的指标指标的名称啊,然后写一下,写一下,然后内容就不用写,然后这个是 这个,这个是什么技术指标?这是复图的啊,复图我就选择复图,主图就选择主图,然后这里的话就是他的那个。呃,这里就是他的那个外置参数啊,外置参数大家看一下参数有多少?这个每一个 每个不一样的啊,每每个软件的就是每个代码,就是根据自身的条件去设置的啊,根据自身条件设置,他没有规定是固定是多少的。我们现在只是给大家做一个演示啊,啊?做个演示啊,像这样子的话,然后大家就再去 点个圆码,然后圆码已经复制好了算,然后粘贴粘到上去过后你就要去测试了啊,你去测试,测试过后如果说可以你再去再去,再然后再去保存就可以了,因为刚才 我就没有测试,我没测试,现在是这样子的,是吧?啊?然后我就没有去搞参数,如果是下次像现在,现在我这个输入输入好了,那我现在选股怎么选呢?选股的话我就要假设这样子选股,我首页,首页 啊,是我的选股的首页,我就选股,是吧?选股的话我就选股的话,现在是用户指标,我自己的指标是什么样的? 好了,然后我现在,现在是,现在是用什么选股公式选公司呢?我用什么条件选股哈,那我就现在现在就先用什么条件选股,我就选出来好了 啊。然后我选的话记住要选不要不负全的,不选好的我们就直接选股就可以了。大家看一下 是不是是不是出来了,然后这个上面就是切换的,切换一个一个的,就切换一个一个,所以教大家如何去使用就行了,然后大家看怎么使用啊?大家看看怎么用,这样子就知道了,是吧? 这样子,这样子好,大家看一下他就应该是明白意思,然后去切换一下,切换一下,然后就看他,然后他选股公式的话,他会在这这里,然后我们自己去放放置在哪里他就可以,首页上面就有啊 啊,这里就是宣布公司啊,更多功能,这里还有更多功能啊,然后大家自己去看看啊,谢谢大家。
639老杨换网名了


猜你喜欢
- 2904小晓枫